You’ve got the data. But do you have the context?
Most teams today are drowning in productivity metrics. They track time, app usage, idle minutes, and collaboration hours. The numbers pile up week after week. Even so, leaders still find themselves asking the same questions:
“Are we actually performing well?”
“What does “good” look like?”
“Where are we falling behind?”
Here’s the problem: internal metrics, on their own, don’t tell the full story.
It’s like checking your speedometer without knowing the speed limit. You might be going fast or just fast compared to last week. Without a benchmark, the data loses meaning.
And that lack of clarity has consequences. A manager might think a team is underperforming and push harder when they’re already in the top 30% of their peers. Or worse, a team burning out might be misread as just “crushing it” because their hours are high.
In one hypothetical case, a sales support team logs an average of 9 active hours per day, far above the company average. But when compared to similar teams across a matched peer group, their conversion outcomes are 40% lower. The time spent isn’t translating to value.
In one recent survey by Salesforce, “less than half of business leaders reported full confidence in their ability to find, analyse, and act on data. Specifically, over 76% felt pressure to be data‑driven thanks to AI’s rise, but 54% admitted they were not fully confident in their skills to interpret and use that data effectively.”
That disconnect doesn’t just hinder performance, it risks decision paralysis, misallocated investment, and damage to team morale.
That’s where benchmarking enters the picture. And why features like Benchmarks AI are gaining attention from operations and analytics leaders who are done flying blind.
What we’ll cover
Why internal data can be misleading
Tracking productivity internally is no longer the challenge. Most teams have dashboards full of time logs, app usage breakdowns, employee monitoring data, and engagement charts.
But here’s the truth: internal metrics only tell you how your team is performing compared to itself. Without context, they don’t show how you measure up against similar teams doing similar work.
And without external benchmarks, that data can be dangerously misleading.
Here’s why:
- You might overestimate performance by comparing only to past internal averages
- You risk misplaced coaching or tool investments based on skewed metrics
- You may end up rewarding busyness over effectiveness, simply because the team looks active
Let’s say your design team logs 42 hours per week on average. Productivity reports show minimal idle time and consistent app usage.
On paper, they appear to be doing well. However, when benchmarked against a matched peer group using the same creative tools and workflows, they fall into the bottom 25% for productive time.
Another team in customer operations might also appear busy. They spend more than 10 hours each week in collaboration tools like Slack and Zoom, but they struggle to stay consistent in task tools such as Jira or Salesforce.
When benchmarked against similar teams, the data tells a different story. Overcommunication and frequent context switching are pulling them away from their core work.
This kind of drift is hard to detect internally. Without an external baseline, there’s no way to know if teams are working in line with expectations, or slowly veering off course.

What internal metrics miss and benchmarking reveals?
Benchmarking isn’t about comparing teams to create winners and losers. It’s about bringing clarity and context to internal data.
Most teams already track hours worked, app usage, time management habits, and engagement patterns. But these numbers only explain what’s happening inside your own walls.
Without external reference points, it’s impossible to know whether those numbers reflect strong performance or just familiar patterns.
Benchmarking adds the perspective that internal metrics lack.
When teams are compared to others doing similar work, with the same tools and workflows, leaders gain insights that are both practical and directional:
1. Uncover gaps that internal reports miss
Internal reports often highlight what’s changing, but not how that compares to others doing similar work. A team might look consistent on paper.
Their hours are logged, and tools are being used. However, benchmarking may show they’re in the bottom 25% for output or task tool usage. That’s a signal to investigate further.
2. Find high-performing habits worth scaling
When one team consistently performs above the 75th percentile, it’s not luck, it’s a workflow. Benchmarking can help pinpoint the behaviours, tools, or time allocation that lead to stronger results. These insights can then guide coaching, onboarding, or cross-team improvements.
3. Detect early signs of burnout or inefficiency
A rising workload isn’t always a good thing. If a team’s total hours increase but productive time decreases, benchmarking can reveal a deeper issue. Is it fatigue, distraction, or poor process design? These shifts often don’t show up in internal metrics until it’s too late.
4. Set fair, data-backed goals
Benchmarking allows you to anchor goals to real-world data. Instead of guessing what “good” looks like, you can say, “This team is currently at the 40th percentile, let’s aim for the 60th.”
Percentile targets help align expectations and reduce friction, especially during planning and performance reviews.
And it doesn’t need to be complex or time-consuming. Many leaders use benchmarking as a simple, ongoing layer that builds on their existing metrics and helps them focus on what matters most.
The real benefit is that benchmarking is designed to “guide, not to grade.” The goal is to support teams with meaningful insights, helping managers ask better questions, recognise early signals, and lead with greater confidence.
5 real ways organisations use benchmarking today
From what we’ve seen across many organisations, benchmarking is being used not as a performance scorecard, but as a tool for better planning, coaching, and decision-making.
These are the patterns that consistently show up, both in our broader research and among early Benchmarks AI users.
1. Coaching with confidence
Managers use benchmarking to understand if a team needs support or if expectations need realignment. It replaces guesswork with context, especially when performance shifts aren’t easy to explain with internal data alone.
2. Setting goals teams can actually reach
Benchmarking offers percentile-based targets that are both realistic and motivating. Instead of aiming for arbitrary numbers, leaders can align team goals with what peer groups are actually achieving.
3. Measuring impact with data, not opinions
Whether it’s a new tool, workflow, or training, benchmarking shows if changes are making a real difference. Tracking percentile shifts over time offers a simple way to evaluate effectiveness.
4. Adjusting for regional work patterns
Work habits aren’t universal. Some teams collaborate constantly, others prefer deep focus. Benchmarking reveals those patterns, so leaders can adjust processes or expectations based on how different teams actually operate.
5. Testing ideas before scaling them
Ops teams often use benchmarking to validate pilots or A/B tests. If a new approach improves performance compared to a peer baseline, it’s easier to justify rolling it out across the business.

How top-performing teams use benchmarking well
Benchmarking works best when it’s approached with the right mindset. The most successful organisations use it not as a scoreboard, but as a strategic tool to lead more effectively.
Here’s how they do it:
1. Use it to guide, not pressure
Top-performing teams treat benchmarking as a support mechanism. It gives managers a clearer view of where to focus and helps them lead with confidence. When positioned as guidance, it encourages teams to stay open to coaching and continuous improvement.
2. Compare teams with similar work patterns
Benchmarking is most effective when comparisons are relevant. That means focusing on peer groups who use the same tools, follow similar workflows, and perform similar types of work. This approach ensures your insights are accurate, fair, and actionable.
3. Combine data with dialogue
The best leaders don’t rely on numbers alone. They use benchmarking to spark the right conversations about process, priorities, or team dynamics. It’s the combination of quantitative and qualitative input that drives real improvement.
4. Focus on directional signals, not overanalysis
Benchmarking isn’t about chasing perfection. The teams that use it well track trends over time. They look for consistent movement like rising productivity or better task focus and let those signals shape their planning and support.
To make benchmarking truly useful, you need more than just best practices, you need the right software behind it. One that captures accurate productivity data, highlights meaningful patterns, and gives you real benchmarks to work with. That’s exactly where Time Doctor comes in.
Why Time Doctor makes benchmarking work
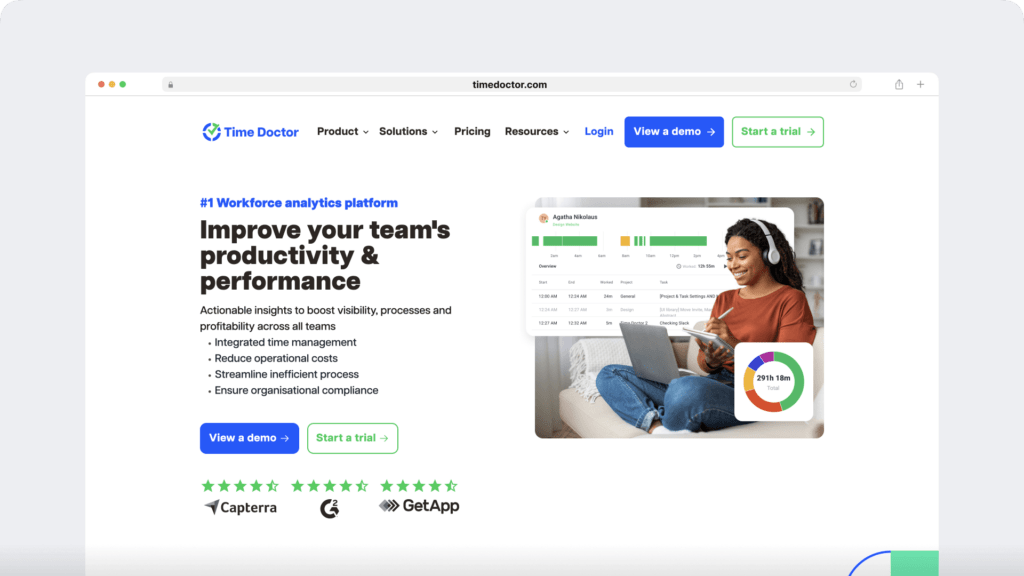
Benchmarking is only as valuable as the data behind it. That’s where the Time Doctor feature stands out. It’s a workforce analytics software that gives leaders visibility into how their teams actually work, whether they’re remote, hybrid, or in the office.
And now, with Benchmarks AI, you can compare that data to peer teams with similar roles, tools, and workflows, giving every metric the context it needs.

Time Doctor Benchmarks AI: built-in benchmarking powered by AI
Benchmarks AI removes the guesswork from performance comparisons by analysing anonymised data from over 250,000 users across 12,000 companies. Instead of relying on broad categories like job titles or industries, it builds peer clusters based on actual work behaviours.
This means your team is benchmarked against others who work in similar ways, using the same tools, workflows, and schedules. As a result, the insights you receive are more accurate, more relevant, and easier to act on.
You’ll get:
- Weekly percentile updates across key productivity metrics
- Apples-to-apples comparisons across individuals, teams, or roles
- Context that helps you set fair goals, catch drift, and lead with more confidence
Time Doctor features that make benchmarking even more valuable:
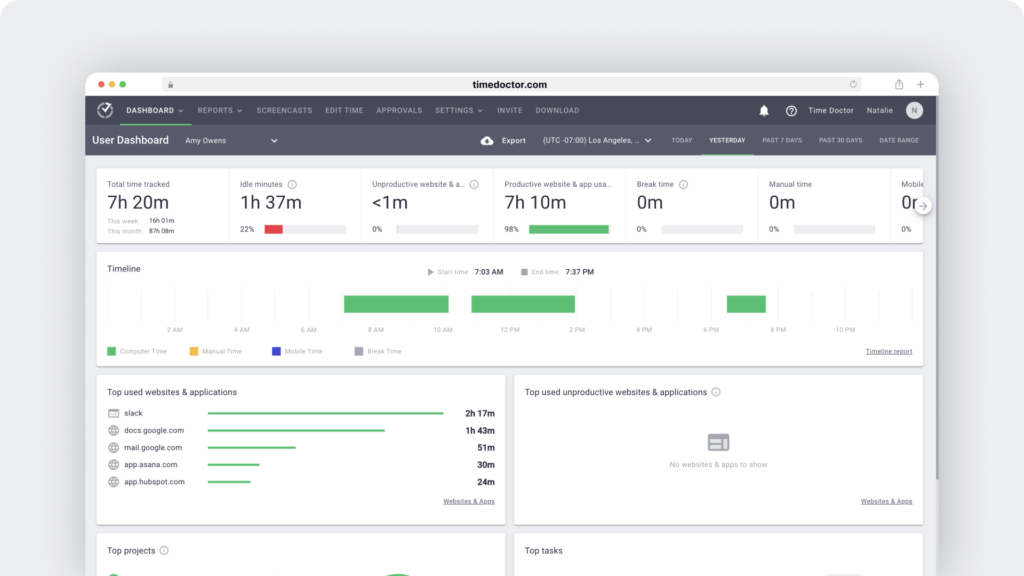
a. Real-time employee time tracking
See total hours worked, productive time, and time spent on tasks, broken down by app and website.
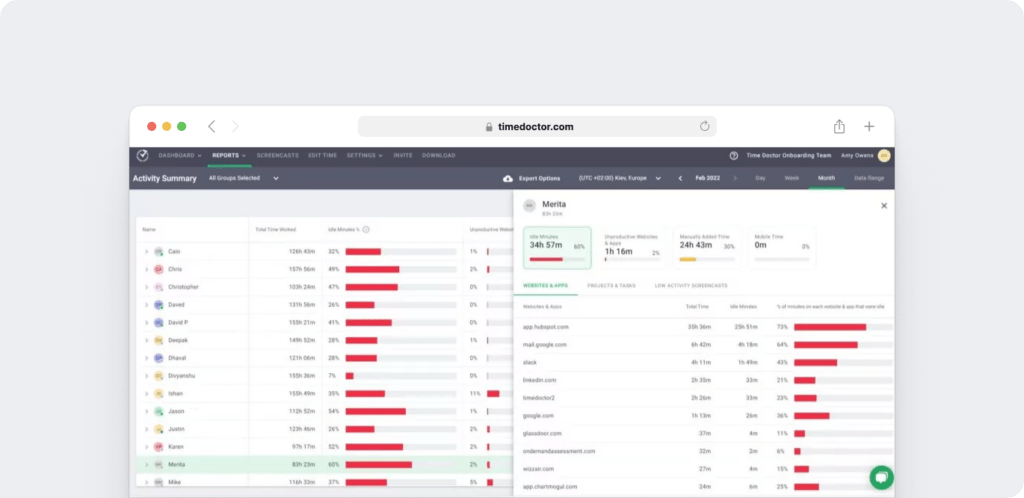
b. Productivity analytics across tools and workflows
Measure how time is spent across collaboration tools, AI platforms, and custom workflows, so you understand not just how long teams work, but how effectively.
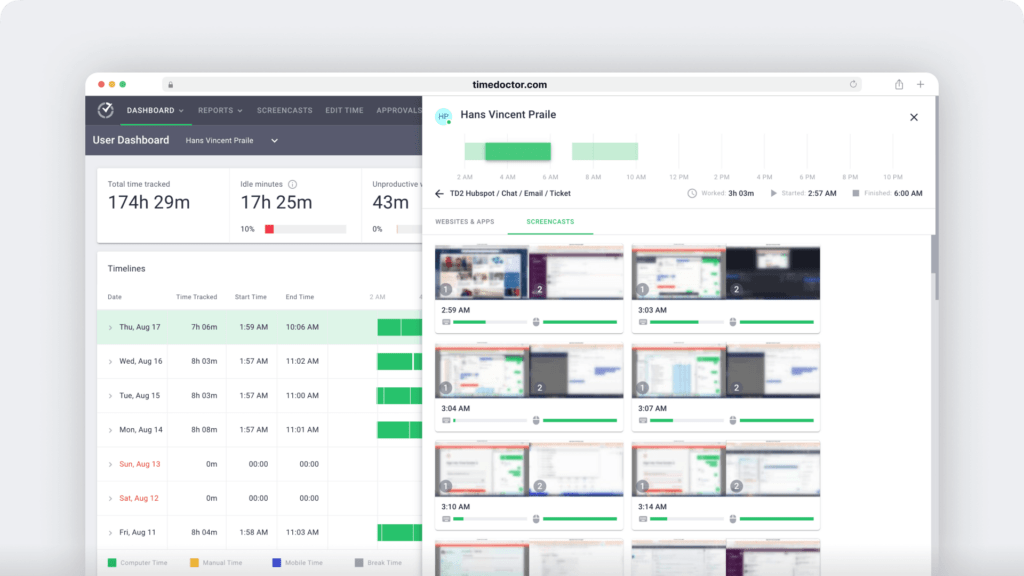
c. Screen monitoring and idle time tracking
Surface passive vs active work patterns, detect distractions, and generate an Unusual Activity Report to highlight anomalies in focus time.
d. Attendance and schedule compliance
Know when people are working, how consistently, and whether patterns are drifting, which is critical for high-burnout or fast-scaling teams.
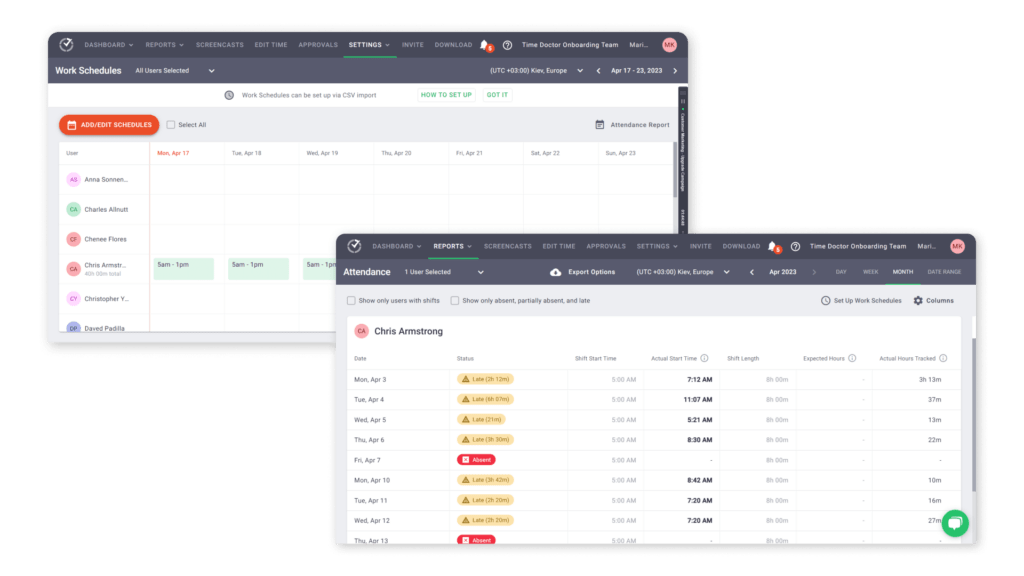
With these capabilities in place, Benchmarks AI becomes more than a comparison tool. It’s a strategic lens that turns all that internal data into context you can lead with.
Final thoughts
When teams are spread across tools, locations, and schedules, it gets harder to see what’s working and even harder to know what to improve. You might be tracking time, screen monitoring, and productivity analytics, but without benchmarking, the numbers don’t always drive actionable insights.
Relying on gut feel might have worked when teams sat in the same room. But with hybrid and distributed work now the norm, leaders need more than internal reports to guide decisions.
That’s where benchmarking comes in, turning scattered productivity data into clear, actionable insight.
It adds context to your employee time tracking, workforce analytics, payroll reports, and productivity metrics.
Whether your team is remote, in-office, or somewhere in between, benchmarking helps you see how they’re really doing, compared to others doing the same kind of work.
Even a light benchmarking layer can shift the conversation from activity to outcomes, and help your teams feel more supported, more focused, and more aligned.
So here’s the question: Are you just tracking time, or are you learning from it?
If your current time tracking software shows you what happened, but not how you compare or where to go next, Benchmarks AI is the missing piece.

FAQs: Smarter decisions start with better comparisons
1. How does Benchmarks AI choose which teams to compare mine with?
Benchmarks AI uses AI-trained models to group teams by how they actually work, not just job title or industry. It considers time tracked, tool usage, workflows, and behaviours to create contextual peer clusters. This ensures comparisons are meaningful and relevant to your real-world operations.
2. Can I track how our performance percentile changes over time?
Yes. Time Doctor updates benchmark comparisons weekly, so you can see whether your teams are improving, falling behind, or holding steady. It’s a powerful way to evaluate progress after new processes, tools, or training are introduced.
3. Is benchmarking just for large enterprises?
Not at all. Time Doctor and Benchmarks AI are used by companies of all sizes from fast-scaling startups to global teams. The peer comparisons are based on real behavioural data, so even smaller teams can benefit from the same level of context and insight.
4. How does Time Doctor keep our data private when benchmarking?
All benchmark data is anonymised and aggregated. No individual or company identifiers are ever shared. Benchmarks AI was built with a privacy-first approach, ensuring full compliance while still delivering accurate peer-based insights.
5. What if my team works in a unique or niche way?
That’s where Benchmarks AI excels. Because peer groups are formed using actual work behaviour. And that includes collaboration tools, task workflows, and work patterns. Your team is compared to others who truly work like they do, no matter how specialised their role is.
6. Can I use Benchmarks AI alongside other analytics tools?
Yes. Time Doctor integrates with dozens of tools, including Jira, Salesforce, Microsoft Teams, and Google Workspace. You can layer benchmark insights on top of your existing productivity and workforce analytics for a complete, directional view.
7. How does Time Doctor help me act on benchmarking insights?
Time Doctor doesn’t just show you data, it helps you make decisions. With detailed productivity analytics, idle time tracking, attendance insights, and screen activity monitoring, you can dig into the “why” behind each benchmark and plan the next steps confidently.


